Troubleshooting
Security Issues
Data / Tag Issues
Debug Tool
Building advanced interfaces can be complicated, especially when you are juggling hundreds of tags across different systems, maybe scattered across the world. As a UI developer, you will often need to inspect to see what information is passing between your OAS Server and your interface. To help you work through issues quickly, we've provided a built-in Debug Tool that allows you to monitor and inspect the network traffic between the UI surface and the OAS Server. We also give you a way to download these Debug Logs so that you can provide them to OAS Support in the event that we need more information to help you diagnose your issue.
The Debug Tool is a toggleable panel that you can open and close to review the latest network traffic.
Navigating the Debug Tool
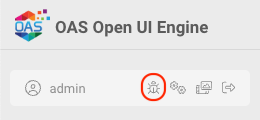
To open the Debug Tool panel, click the icon near your user name in the top left of the interface. This will open up the Debug panel at the right of your browser window.
Across the top of the Debug tool are a number of icons to control the log.
- Collapses the Debug panel. Click the Bug icon by your username to reopen the panel.
- Shifts the Debug panel from the right side of the screen to the bottom.
- Places the Debug panel back on the right side default position.
- Collapses all of the log entries you have expanded to view the log details.
- Starts recording events to the Debug log.
- Indicates the log is recording events. Clicking the button will stop the recording.
- Downloads a copy of the log or to submit when requested by OAS Support.
- Clears the current log
TIP
The Debug Log will record events even when the panel is closed. This allows you to start recording, hide the panel to perform a series of steps, and then reopen the panel to investigate the results.
Recording a Log
Recording a log is easy and straightforward:
- Open up the Debug Tool
- Click the
Record Button - Hide the Debug Panel
- Use the interface to test out your specific example
- Reopen the Debug Tool
- Click the Stop button to stop the recording
Note
Currently the Debug Tool only logs events that occur during Edit mode in the tool. This means its recording your clicks and changes that occur while you are creating the interface. We are planning on adding Tag data based inspection that can be used to inspect server tag data messages in a future release.
Investigating the Log
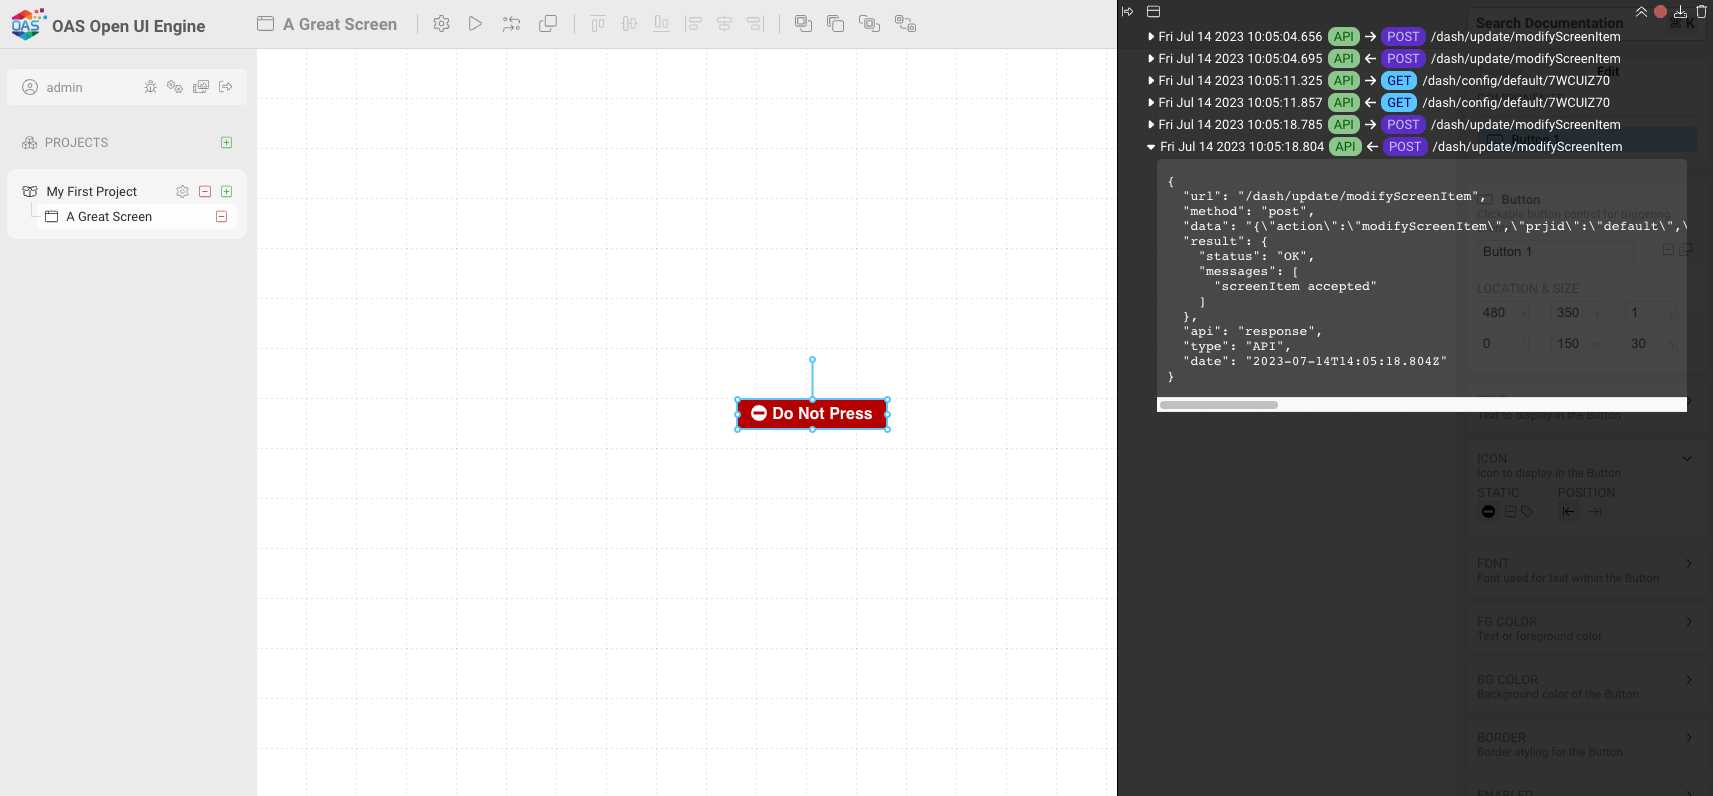
The Debug tool will record each request made between the UIEngine interface and the OAS Server as it relates to modifying and editing the interface.
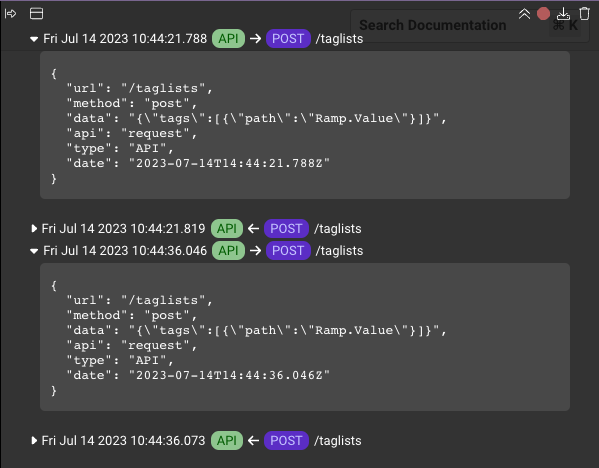
Each entry in the log can be expanded and closed to see its details. All entries can be collapsed at once with the button. Within each entry is the JSON data that was communicated between the UIEngine Client and the OAS Server, as each change is made to the design surface. Taken together, these JSON are the events that create and modify the UI you are building.
Submitting a Log
During customer support, the OAS support technician may ask you for your Debug Log so that we can help you troubleshoot a bug or interface issue you may be experiencing. To provide us with this information, follow these steps:
- Perform the steps above to record your log to recreate the issue or error you are experiencing.
- Open up the Debug Tool if its not already open.
- Click the Download button to save your log to your local filesystem.
- OAS Support will work with you to securely transmit the log information to us for investigation.
Log only what you need
For optimum support, please only record and send logs around the smallest number of actions to recreate the problem you are experiencing. There can be many messages that are recorded for a series of changes, so limit your log to the time just around where the issue occurs. Doing this speeds our efforts for resolution as we can focus on your specific problem easiler.