Manufacturing Data Analytics & SCADA Trend Software
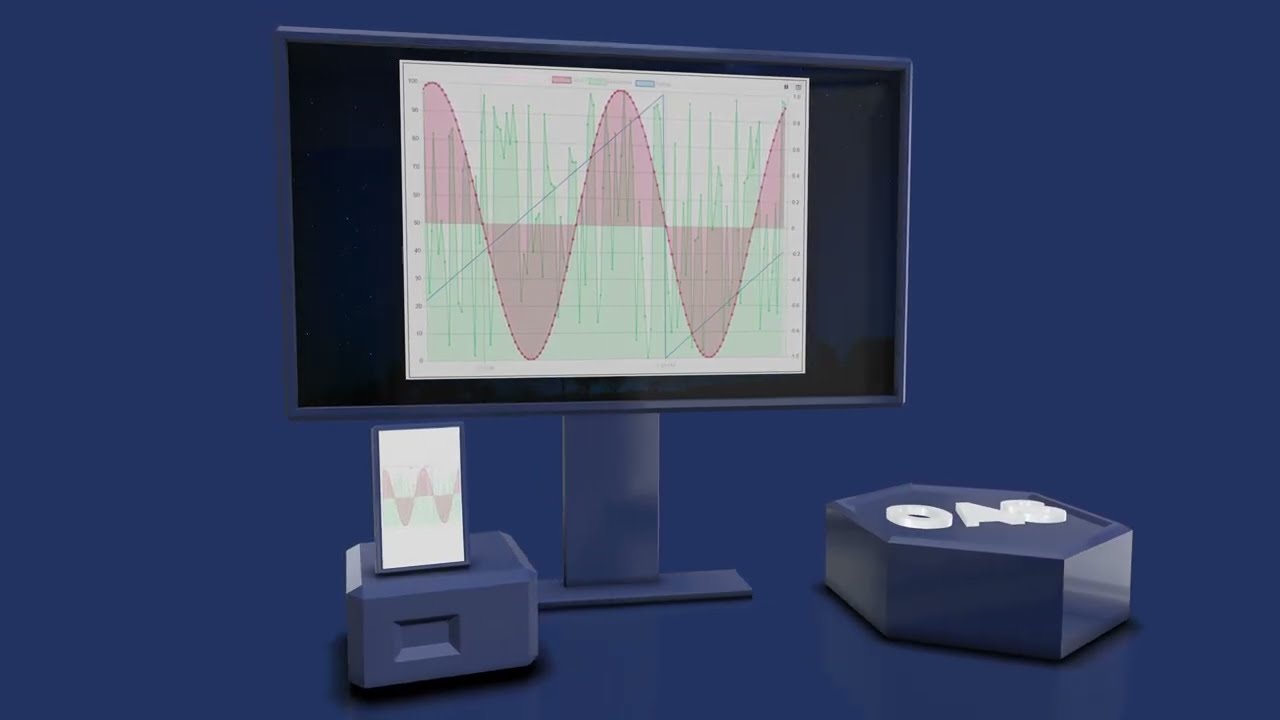
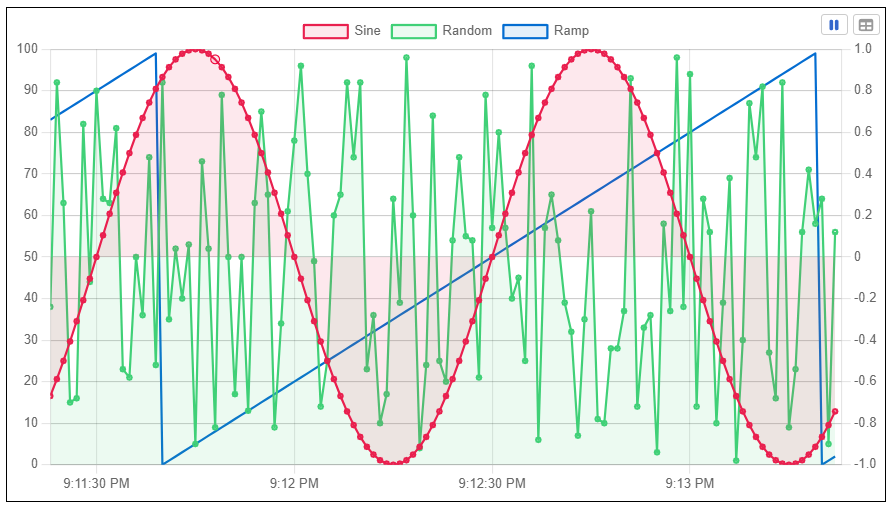
View real-time and historical Trend data directly in your web applications on any device and any browser. With platform-independent technologies such as HTML5, CSS, and JavaScript, web developers can bring SCADA analytics and industrial data to life through intuitive dashboards and reports designed for operators, engineers, and analysts.
Add Real Time and Historical Trends to Your Web Apps
OAS Web Trend easily integrates into existing or newly developed applications across any front-end framework. You can use it with vanilla HTML/JavaScript or other advanced platforms.
This flexibility supports interactive visualizations of HMI data analytics, SCADA data analytics, and other industrial data analytics use cases across all devices with a browser.
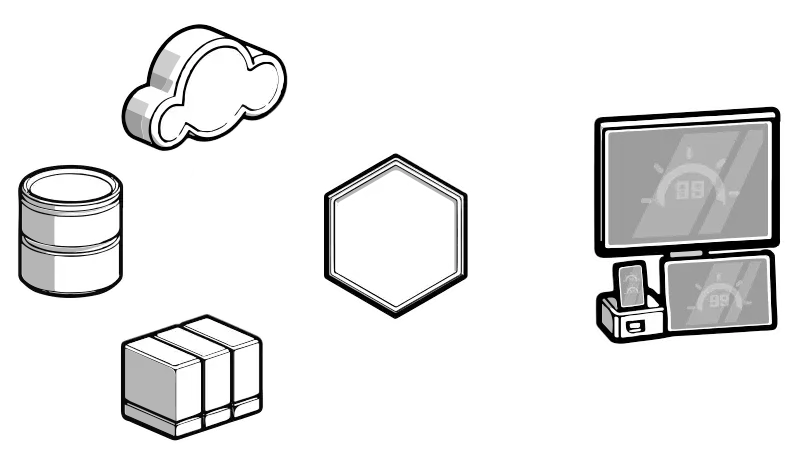
a server-based, highly-scalable, network platform that enables the transport and transformation of your data
Data HistorianAchieve fault-tolerant logging, zero data loss, and multi-destination storage with our high-performance Store and Forward technology.
Visualization ToolsBuild Visualizations, User Interfaces, and server configuration interfaces for .NET, web technologies, native iOS and Android mobile apps
Device & Data ConnectorsThe OAS Platform provides rapid communications and connectivity to a wide variety of PLCs, devices, and databases.
IoT ConnectorsConnect to cloud-base IoT gateways such as AWS, Azure IoT Hub, Azure Event Hubs, Kafka, and more.
Alarm Logging & NotificationCapture events on each data point, log to open formats for historical analysis and archiving, and trigger real time notifications
SDKs & APIsExplore a wide variety of Developer Tools and APIs to allow you to create applications and system integrations to execute in any environment.
Networking FeaturesOpen Automation Software implements edge computing with a Distributed Network Architecture.
Download a fully functional trial of Open Automation SoftwareKey Features & Benefits
Browser Compatibility
Access your industrial data analytics in all modern browsers like MS Edge, Chrome, Safari, and more. Compatible with Windows, macOS, iOS, and Android, Web Trend is built with standard technologies, requiring no plugins or extra installations.
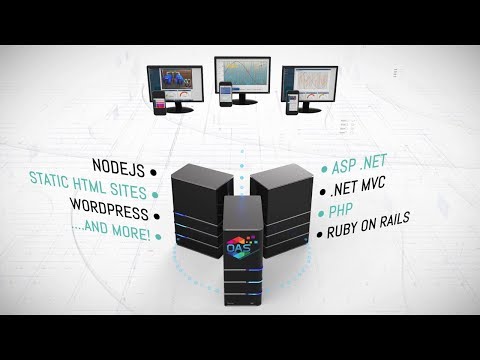
Use with Existing Frameworks
Since Web Trend is built with standard HTML and JavaScript, it works easily with platforms like ASP.NET, Ruby on Rails, PHP, Angular, React, and VueJS. This gives you the flexibility to plug data analytics for manufacturing and industrial IoT data analytics into your custom dashboards without a lot of extra work.
Security
All data transmissions are encrypted using SSL when enabled in the OAS server. This ensures your industrial data analytics software remains secure during browser-server communication.
Direct Data Delivery
OAS delivers data directly between server and client without relying on middle-layer services. This reduces web server load and enables fast, responsive SCADA analytics and manufacturing data analytics.
Using Web Trend
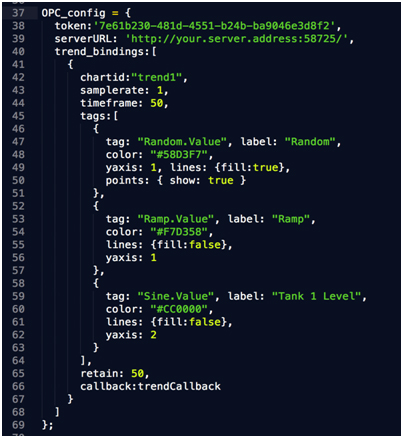
Configuration Syntax
Within your web application code, you’ll set up the Web Trend data feed by choosing which OAS Tags to monitor, adding metadata, and selecting display options. You’ll also create a function that runs as data streams to the client.
From there, you can plug the data into your own code, use it with charting tools like ChartJS or Flot Charts, or run client-side calculations . OAS handles all of the data collection, communications, and delivery, while leaving you free to decide how that data is displayed.
Looking for a No-Code Solution?
The OAS Open UIEngine allows users to create full-featured HMI and SCADA interfaces without writing code. Its drag-and-drop design tools and built-in Trend Component make it easy to display live and historical data. Perfect for building scalable industrial data analytics software when development resources are limited.
Common Questions
What skills are necessary to use Web Trend?
Web Trend is based on web development standards like HTML and JavaScript. It can be integrated into virtually any web application front-end platform by developers able to craft basic web pages.
Can the Web Trend chart appearance be customized?
Yes, because the core of Web Trend is an HTTP data feed exposed by JavaScript, you can use most charting libraries for displaying data in any format you prefer.
Learn how thousands of customers are using the OAS Product Platform around the globe to achieve truly open industrial automation
24/7/365
Support
Technical support available by phone, chat, and email
30+ Years
Experience
Product efficacy, market testing, and reliability
Used in 10K+
Data Servers
OAS is used in thousands of businesses worldwide
OAS Platform Features
Cross-Platform Support
The OAS Platform supports multiple operating systems and deployment options including Windows, Linux, Docker Containers, and can even run on low footprint devices such as a Raspberry PI 4.
Networking
OAS is an edge solution that offers flexible networking options for standalone installations, multi-tenant data aggregation, and even secure unidirectional data transport.
Programmatic Setup
Utilize our .NET SDK or REST API for flexible and automated setup, ensuring full integration with your asset management software. You can also import and export CSV files, which helps you work with Excel and third-party applications.
Calculations, Time On, Counts, and Totals
Merge data from various controllers and additional data sources while performing real-time computations and logic processing, all without the need for coding. Monitor the duration of activities for specific points and the frequency of their transitions over a defined period. Aggregate analog values both daily and over the entire timeline.
See How We Compare
The initial cost of OAS is far less than our competitors – but the savings don’t stop there. We work with OEMS and System Integrators to provide perpetual licenses with quantity discounts with flexible tag pricing and unlimited client connections.
No Question Left Unanswered
We make getting started with OAS easy - Browse our extensive Knowledge Base of articles on Getting Started as well as How To content that takes you step-by-step through building a solution, and finally learn more about specific features and configurations.
Getting Started - Download, Setup & Support
Step-by-step introduction to using the Open Automation Software platform
How to manually add and define Tags using the Configure OAS application.
Familiarize yourself with the following steps to setup Web Trend.
A series of step by step solutions using Web Trend.
Web Trend Programming Reference
Learn about programmatically configuring Web Trend.
More about the 3 key networking methods included with licenses.
How to quickly access options and make custom changes.
How to active and manage OAS license.
Related Videos